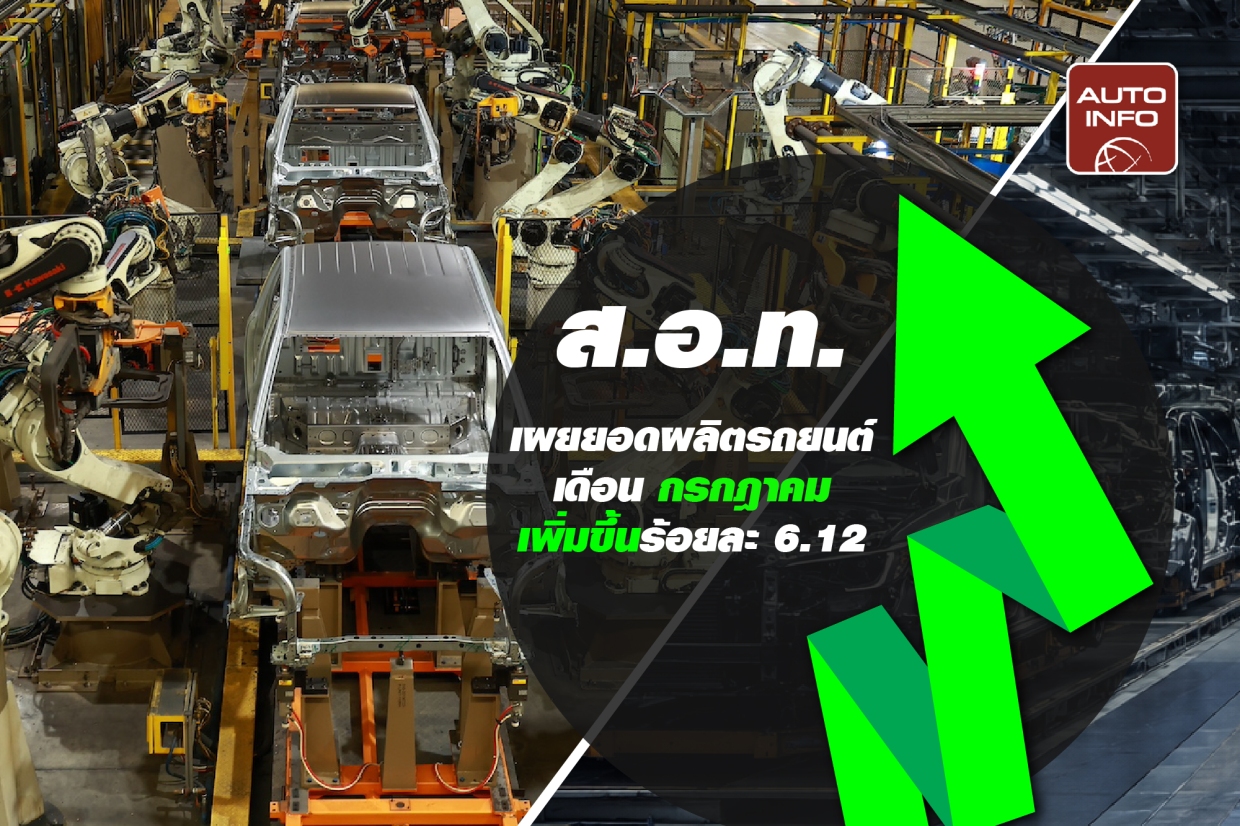
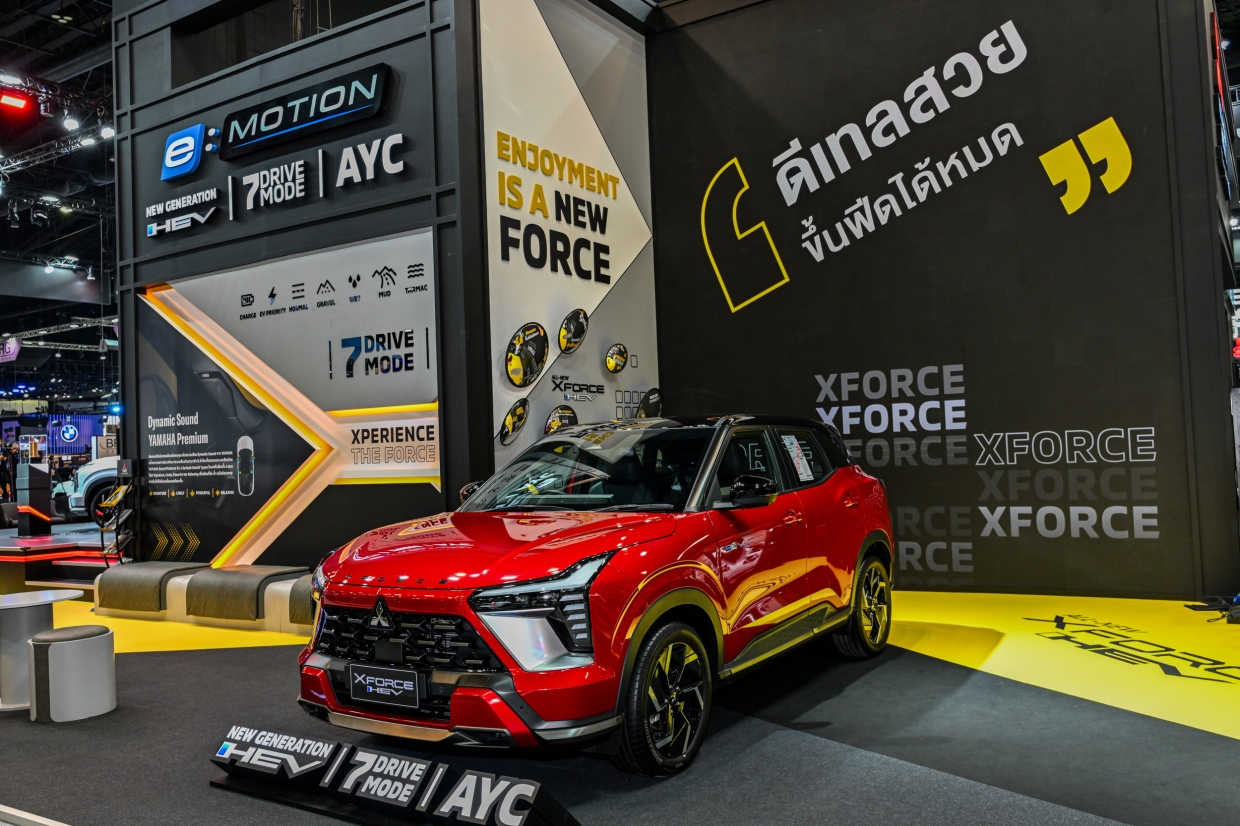
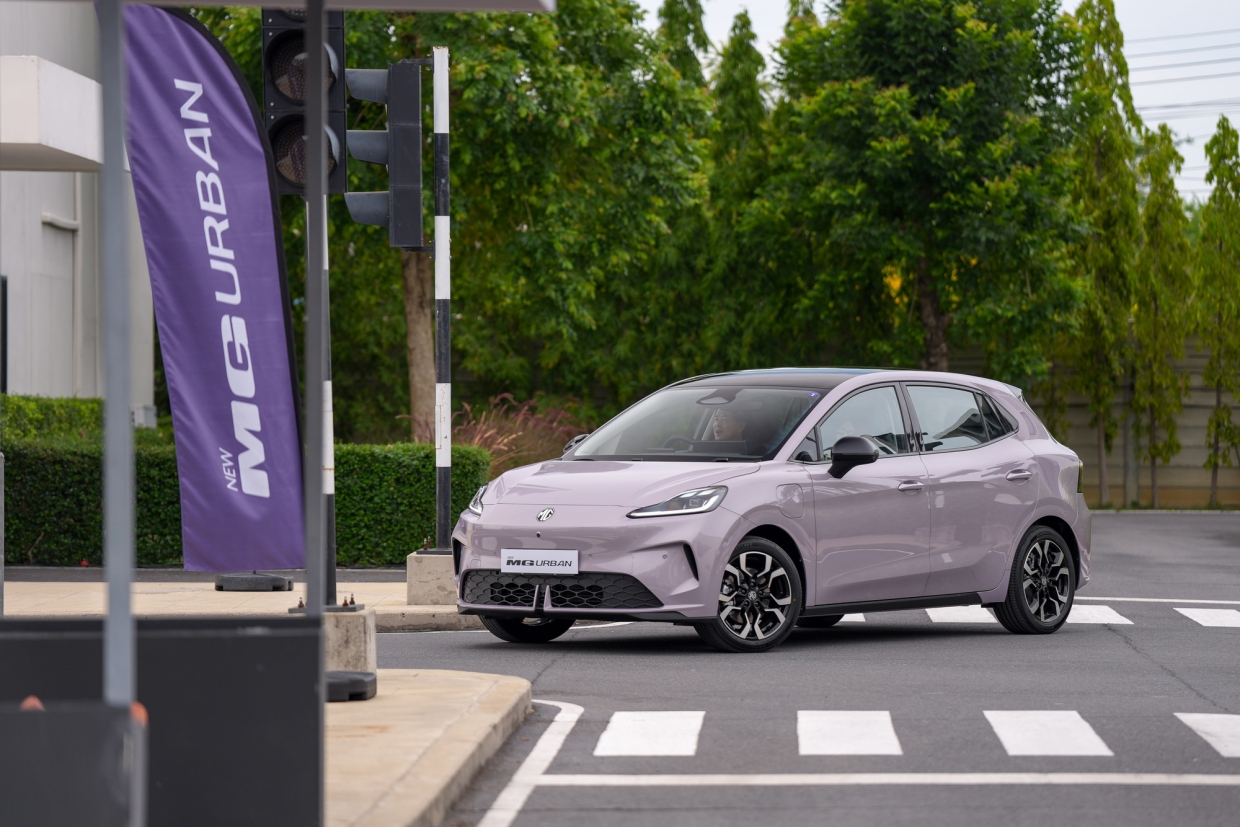
The Federation of Thai Industries revealed that the direction of the Thai automotive industry in July shows bright prospects with continuous growth in all markets. Car production reached 117,383 units, an increase of 6.12%. Electric passenger car production reached 13,422 units, an increase of 271.80%. Electric pickup truck production reached 346 units, an increase of 686.36%. Sales reached 59,196 units, an increase of 20.07%. Battery Electric Vehicle (BEV) passenger car sales reached 21,492 units, an increase of 126.11%.
Electric pickup truck sales reached 467 units, an increase of 764.81%. Exports reached 74,169 units, an increase of 2.39%. Electric passenger car exports reached 1,799 units, an increase of 1,399.17%, and electric pickup truck exports reached 299 units, an increase of 536.17%.
Surapong Paisitpatanapong, Advisor to the Chairman of the Automotive Industry Group and Spokesperson of the Automotive Industry Group, The Federation of Thai Industries (FTI), revealed the production volume, domestic sales, and exports of automobiles and motorcycles in the country for July 2569.
Production
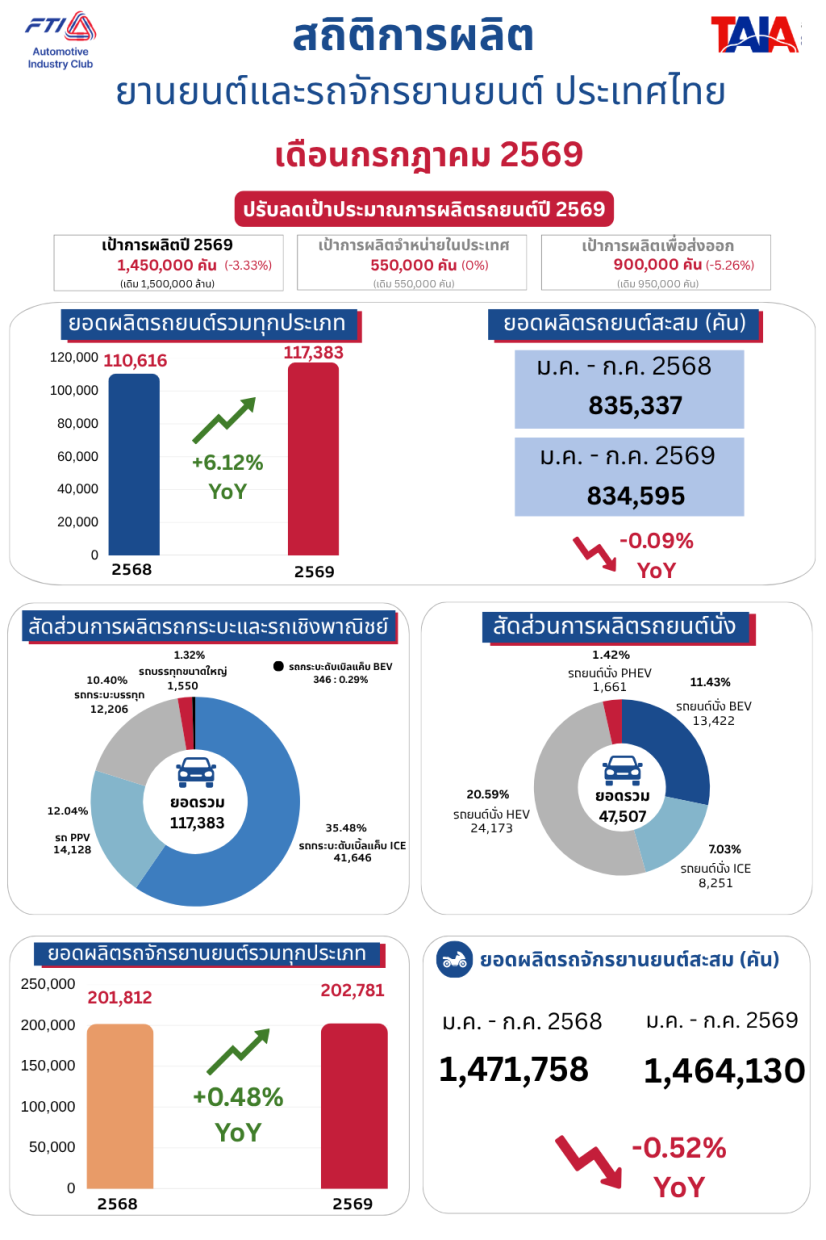
The total number of automobiles produced in July 2569 was 117,383 units, an increase of 6.12% from July 2568.
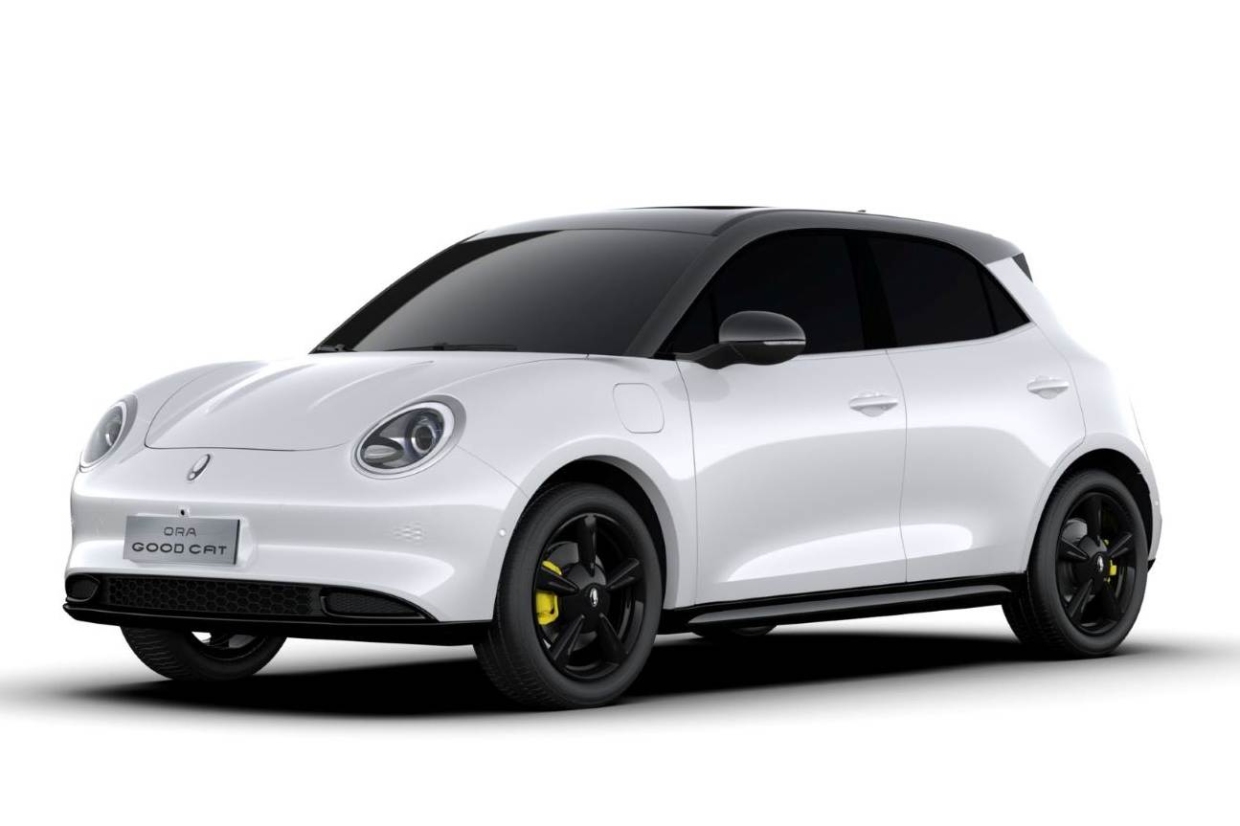
This increase was due to the production of 13,422 electric passenger cars, up 271%; 1,661 PHEVs, up 295.48%; and 24,173 HEVs, up 95.35%, driven by increased domestic sales of electric vehicles due to rising oil prices from the Middle East conflict and exports to trading partners. Meanwhile, internal combustion engine passenger car production was only 8,251 units, a decrease of 62.49%.
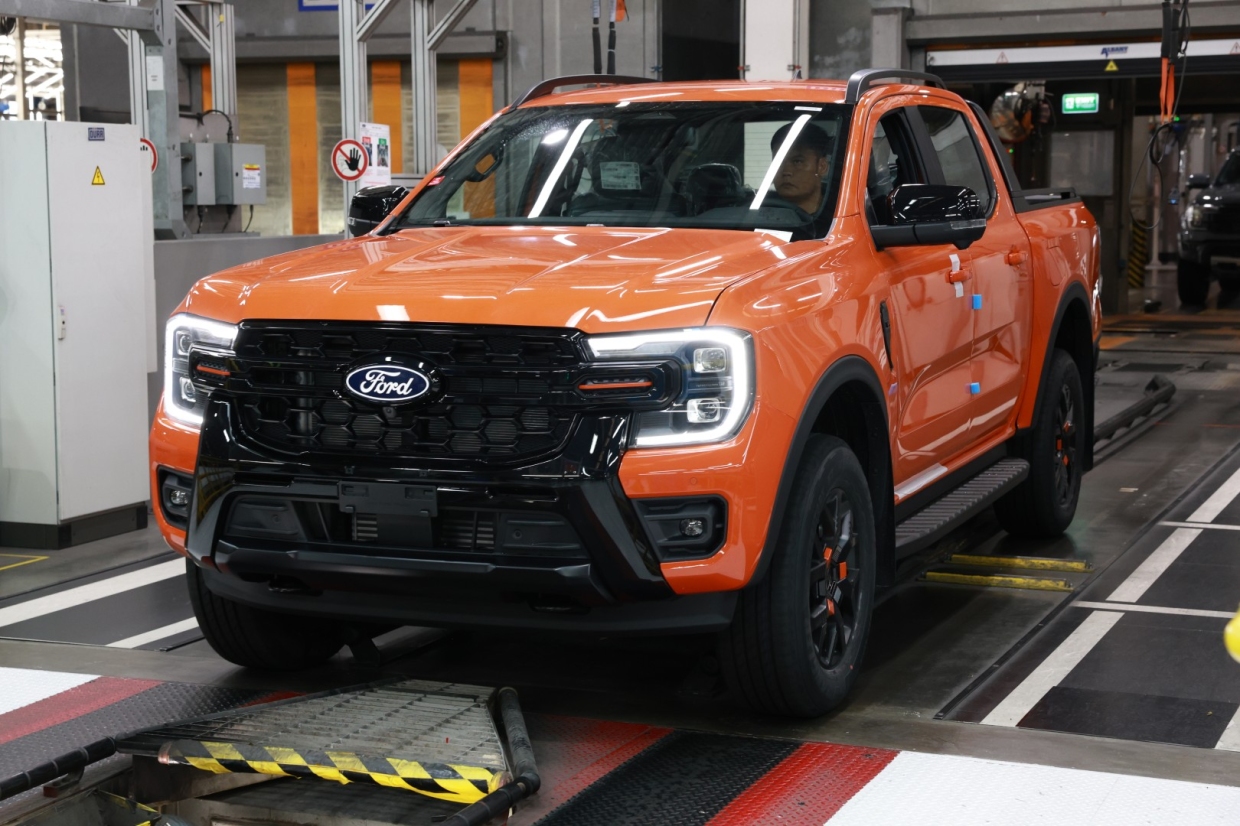
Pickup truck production continued to decline in line with falling domestic sales, but electric pickup truck production reached 346 units, an increase of 686.36%, for domestic sales and export. Truck production reached 1,550 units, an increase of 108.05%, due to the resumption of normal production after the factory relocation was completed.
The total number of automobiles produced from January-July 2569 was 834,595 units, a decrease of 0.09% from January-July 2568.
Passenger Cars In July 2569, 47,507 units were produced, an increase of 23.72% from July 2568, categorized as follows:
• Internal Combustion Engine (ICE) passenger cars numbered 8,251 units, a decrease of 62.49% from July 2568.
• Battery Electric Vehicle (BEV) passenger cars numbered 13,422 units, an increase of 271.80% from July 2568.
• Plug-in Hybrid Electric Vehicle (PHEV) passenger cars numbered 1,661 units, an increase of 295.48% from July 2568.
• Hybrid Electric Vehicle (HEV) passenger cars numbered 24,173 units, an increase of 95.35% from July 2568.
Passenger car production from January-July 2569 totaled 299,878 units, a decrease of 1.05% from January-July 2568, accounting for 35.93% of total automobile production, categorized as follows:
• Internal Combustion Engine (ICE) passenger cars numbered 92,184 units, a decrease of 34.49% from January-July 2568.
• Battery Electric Vehicle (BEV) passenger cars numbered 47,452 units, an increase of 73.13% from January-July 2568.
• Plug-in Hybrid Electric Vehicle (PHEV) passenger cars numbered 13,980 units, an increase of 34.98% from January-July 2568.
• Hybrid Electric Vehicle (HEV) passenger cars numbered 146,262 units, an increase of 17.41% from January-July 2568.
Passenger vehicles under 10 tons and over 10 tons in July 2569 had no production, and similarly, there was no production from January-July 2569.
Trucks In July 2569, a total of 69,876 units were produced, a decrease of 3.24% from July 2568. From January-July 2569, a total of 534,717 units were produced, an increase of 0.46% from January-July 2568.
1-ton pickup trucks In July 2569, a total of 68,326 units were produced, a decrease of 4.40% from July 2568. From January-July 2569, a total of 524,483 units were produced, a decrease of 0.51% from January-July 2568, accounting for 62.84% of total automobile production, categorized as follows:
• Pickup trucks (cargo) had an accumulated total of 87,107 units, an increase of 2.56% from January-July 2568.
• Double Cab pickup trucks had an accumulated total of 327,624 units, a decrease of 3.10% from January-July 2568.
• Double Cab BEV pickup trucks had an accumulated total of 2,447 units, an increase of 1,726.12% from January-July 2568.
• PPV pickup trucks had an accumulated total of 107,305 units, an increase of 3.19% from January-July 2568.
Trucks under 5 tons to over 10 tons In July 2569, 1,550 units were produced, an increase of 108.05% from July 2568. From January-July 2569, 10,234 units were produced, an increase of 100.12% from January-July 2568.
Production for Export
In July 2569, a total of 72,679 automobiles were produced for export, accounting for 61.95% of total production, a decrease of 1.92% from July 2568. From January-July 2569, a total of 521,840 units were produced for export, accounting for 62.53% of total production, a decrease of 4.97% from the same period in 2568.
Passenger cars In July 2569, 16,200 units were produced for export, a decrease of 9.11% from July 2568. From January-July 2569, a total of 110,085 units were produced for export, a decrease of 4.60% from January-July 2568.
1-ton pickup trucks In July 2569, 56,479 units were produced for export, an increase of 0.36% from July 2568. From January-July 2569, a total of 411,755 units were produced for export, a decrease of 5.06% from January-July 2568, categorized as follows:
• Pickup trucks (cargo) numbered 42,875 units, a decrease of 10.63% from January-July 2568.
• Double Cab pickup trucks numbered 287,270 units, a decrease of 6.12% from January-July 2568.
• PPV pickup trucks numbered 81,610 units, an increase of 2.32% from January-July 2568.
Production for Domestic Sales
In July 2569, a total of 44,704 automobiles were produced for domestic sales, accounting for 38.05% of total production, an increase of 22.42% from July 2568. From January-July 2569, a total of 312,755 units were produced for domestic sales, an increase of 9.27% from January-July 2568.
Passenger cars In July 2569, 31,307 units were produced for domestic sales, an increase of 52.15% from July 2568. From January-July 2569, a total of 189,793 units were produced for domestic sales, accounting for 63.29% of total passenger car production, an increase of 1.13% from January-July 2568.
1-ton pickup trucks In July 2569, 11,847 units were produced for domestic sales, a decrease of 22.03% from July 2568. From January-July 2569, a total of 112,728 units were produced for domestic sales, an increase of 20.65% from January-July 2568, categorized as follows:
Pickup trucks (cargo) numbered 44,232 units, an increase of 19.69% from January-July 2568.
• Double Cab pickup trucks numbered 42,801 units, an increase of 32.70% from January-July 2568.
• PPV pickup trucks numbered 25,695 units, an increase of 6.05% from January-July 2568.
Motorcycles
In July 2569, a total of 202,781 motorcycles were produced, an increase of 0.48% from July 2568. This was divided into 170,084 Completely Built Units (CBUs), an increase of 2.93% from 2568, and 32,697 Completely Knocked Down (CKD) motorcycle parts, a decrease of 10.61% from 2568.
Total motorcycle production from January-July 2569 was 1,464,130 units, a decrease of 0.52% from 2568. This was divided into 1,190,278 Completely Built Units (CBUs), a decrease of 1.40% from 2568, and 273,852 Completely Knocked Down (CKD) motorcycle parts, an increase of 3.52% from 2568.
Sales
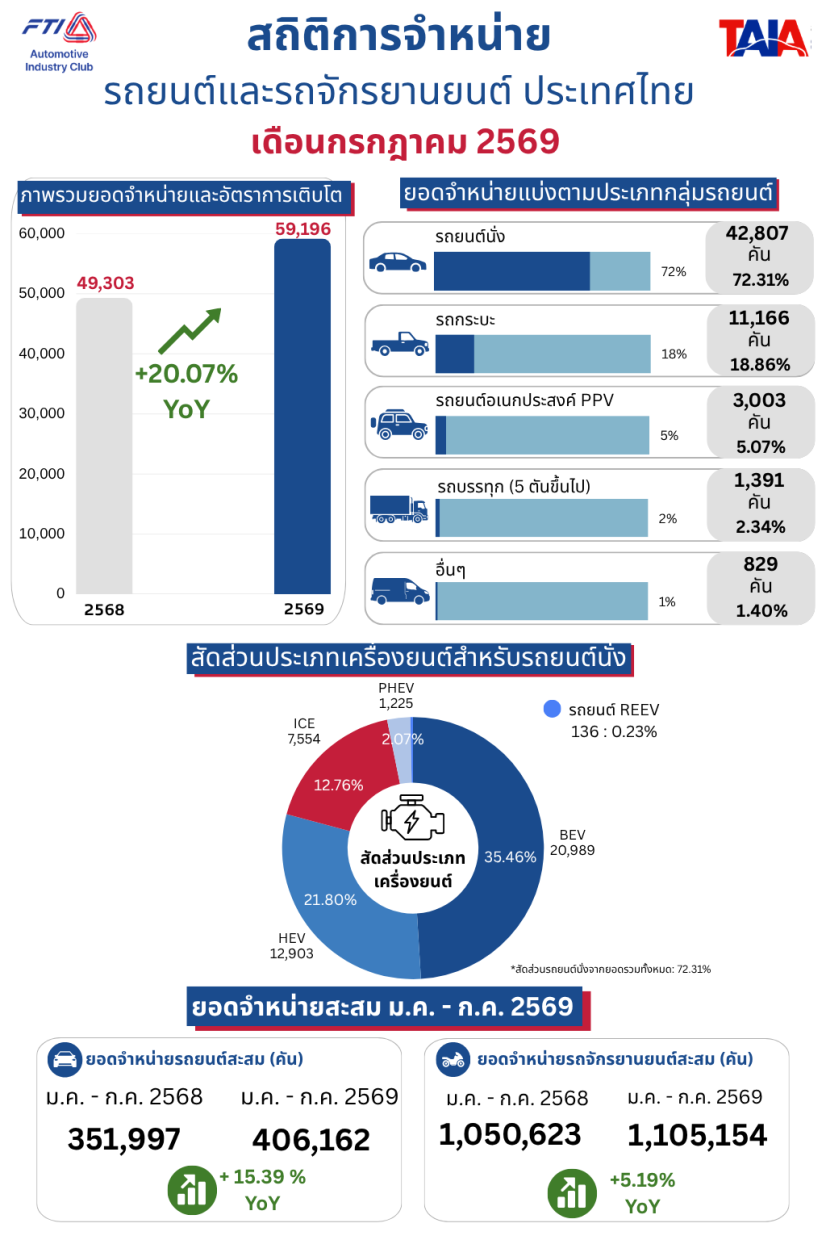
Domestic automobile sales in July 2569 totaled 59,196 units, an increase of 0.80% from June 2569 and an increase of 20.07% from July 2568.
Sales increased because electric vehicles (BEVs) sold 20,989 units, up 122.08%, accounting for 35.46% of total sales. Meanwhile, internal combustion engine passenger cars sold only 7,654 units, down 34.58%, accounting for 12.76% of total sales, due to high oil prices. Pickup truck (cargo) sales continued to decline by 16.22% due to stricter loan approvals from financial institutions, with reports indicating a 7.8% contraction in auto loans.
Of great concern is that out of the 406,162 units sold in the first 7 months of the year, an increase of 15.39%, 125,411 units were electric passenger cars, an increase of 97.39%. However, domestic production of electric passenger cars was only 46,924 units, which is 37.42% of sales, meaning 62.58% of electric vehicle sales were imported. This has led to calls for consideration of taxes that may be unfair to internal combustion engine vehicles and electric vehicles produced in Thailand, which employ Thai workers and use domestically produced parts, contributing to economic growth, but are disadvantaged compared to imported electric vehicles. Therefore, there is a call for the government to adjust the tax structure to be fair to domestically produced vehicles.
Another major concern is the continued decline in pickup truck sales, falling to just over 10,000 units from a previous 30,000+ units per month, a decrease of over 60%. This is due to stricter financial institution policies resulting from the country's low economic growth rate over several quarters; Q2 this year saw 1.9% growth, down from 2.8% in Q1.
The decline in sales of pickup trucks, which use up to 90% domestically produced parts, affects pickup truck parts manufacturers and other industries in the pickup truck supply chain. This leads to a decrease in the country's industrial production index or low growth rates in some months, with capacity utilization below 60% of total capacity. Pickup trucks are Thailand's Product Champion, having moved from Japan's production base to Thailand decades ago for export to over 120 countries and for domestic sales.

When production declines by two-thirds, many parts manufacturers and supply chain businesses suffer, with some parts manufacturers having to close down or relocate investments to other countries. The Joint Standing Committee on Commerce, Industry and Banking (JSCCIB) once proposed two years ago that the government establish a fund to guarantee financial institutions against actual losses from repossessed vehicles, up to 50,000 baht per vehicle, with the condition that financial institutions increase pickup truck loan approvals from the previous month. This aims to boost pickup truck sales and production, providing more employment and income for workers in the supply chain, which will strengthen domestic purchasing power, leading to increased spending on various goods and better household debt repayment. This would foster increased investment and employment, and the government would collect more excise tax, value-added tax, and income tax, which could be used to develop the country and invest in improving citizens' quality of life.
When the economy improves and grows at a higher rate, it attracts foreign investment and encourages Thais to invest. This cyclical growth leads to increasingly higher economic growth rates. When producers and investors can produce and sell more, they generate profits and maintain good liquidity without losses. This attracts existing producers to stay and continue investing in Thailand, alleviating concerns about other countries inviting them to relocate production bases. Achieving economic growth equal to or higher than other countries is the most powerful attraction for foreign and Thai investment.
Passenger cars and SUVs totaled 42,807 units, accounting for 72.31% of total sales, an increase of 32.99% from the same month last year, categorized as follows:
• Internal Combustion Engine (ICE) passenger cars and SUVs totaled 7,554 units, accounting for 12.76% of total sales, a decrease of 34.58% from July 2568.
• Battery Electric Vehicle (BEV) passenger cars and SUVs totaled 20,989 units, accounting for 35.46% of total sales, an increase of 122.08% from July 2568.
• Plug-in Hybrid Electric Vehicle (PHEV) passenger cars and SUVs totaled 1,225 units, accounting for 2.07% of total sales, an increase of 83.66% from July 2568.
• REEV passenger cars and SUVs totaled 136 units, accounting for 0.23% of total sales, a decrease of 27.27% from July 2568.
• Hybrid Electric Vehicle (HEV) passenger cars and SUVs totaled 12,903 units, accounting for 21.80% of total sales, an increase of 24.82% from July 2568.
Pickup truck sales categorized as follows:
• Pickup (1 Ton) trucks totaled 5,084 units, accounting for 8.59% of total sales, a decrease of 16.22% from July 2568.
• BEV Pickup (1 Ton) trucks totaled 8 units, accounting for 0.01% of total sales. There were no sales in July 2568.
• Double Cab pickup trucks totaled 5,602 units, accounting for 9.46% of total sales, an increase of 14.33% from July 2568.
• Double Cab BEV pickup trucks totaled 467 units, accounting for 0.79% of total sales, an increase of 764.81% from July 2568.
• Double Cab REEV pickup trucks totaled 1 unit. There were no sales in July 2568.
• Double Cab HEV pickup trucks totaled 4 units. There were no sales in July 2568.
PPV vehicles totaled 3,003 units, a decrease of 21.39% from July 2568.
Trucks weighing 5-10 tons totaled 1,363 units, an increase of 2.48% from July 2568. Electric trucks weighing 5-10 tons (BEV) totaled 28 units. There were no sales in July 2568.
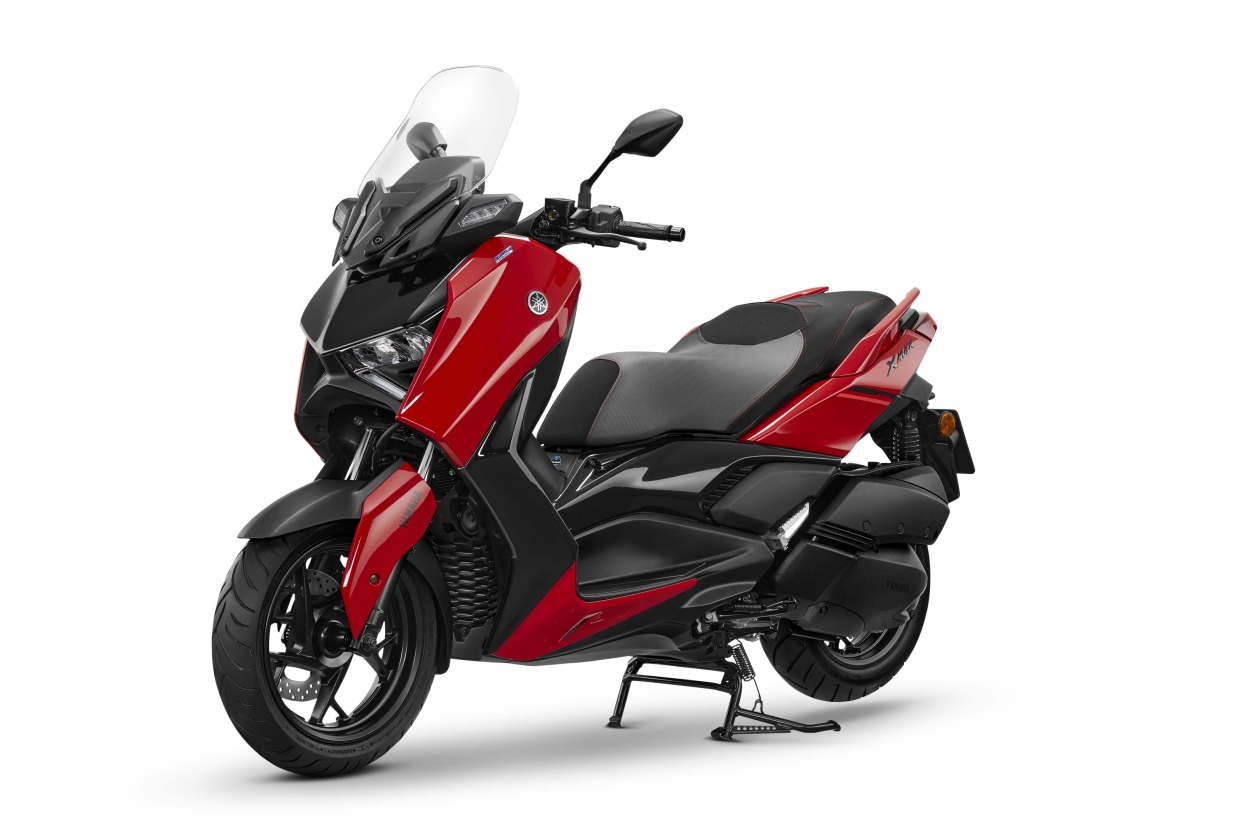
Motorcycle sales totaled 151,801 units, a decrease of 14.73% from June 2569 and an increase of 5.08% from July 2568.
From January-July 2569, total automobile sales were 406,162 units, an increase of 15.39% from the same period in 2568, categorized as follows:
• Internal Combustion Engine (ICE) passenger cars and SUVs totaled 62,055 units, accounting for 15.28% of total sales, a decrease of 26.18% from January-July 2568.
• Battery Electric Vehicle (BEV) passenger cars and SUVs totaled 125,411 units, accounting for 30.88% of total sales, an increase of 97.39% from January-July 2568.
• Plug-in Hybrid Electric Vehicle (PHEV) passenger cars and SUVs totaled 7,248 units, accounting for 1.78% of total sales, an increase of 27.81% from January-July 2568.
• REEV passenger cars and SUVs totaled 975 units, accounting for 0.24% of total sales, an increase of 421.39% from January-July 2568.
• Hybrid Electric Vehicle (HEV) passenger cars and SUVs totaled 87,543 units, accounting for 21.55% of total sales, an increase of 20.88% from January-July 2568.
Pickup truck sales categorized as follows:
• Pickup (1 Ton) trucks totaled 37,369 units, accounting for 9.20% of total sales, a decrease of 17.38% from January-July 2568.
• BEV Pickup (1 Ton) trucks totaled 22 units, accounting for 0.01% of total sales. There were no sales from January-July 2568.
• Double Cab pickup trucks totaled 43,454 units, accounting for 10.70% of total sales, an increase of 10.38% from January-July 2568.
• Double Cab BEV pickup trucks totaled 1,351 units, accounting for 0.33% of total sales, an increase of 219.39% from January-July 2568.
• Double Cab REEV pickup trucks totaled 18 units, an increase of 200.00% from January-July 2568.
• Double Cab HEV pickup trucks totaled 219 units. There were no sales from January-July 2568.
PPV vehicles totaled 23,864 units, a decrease of 2.73% from January-July 2568.
Trucks weighing 5-10 tons totaled 10,478 units, an increase of 22.75% from January-July 2568. Electric trucks weighing 5-10 tons (BEV) totaled 100 units. There were no sales from January-July 2568.
Motorcycle sales from January-July 2569 totaled 1,105,154 units, an increase of 5.19% from the same period in 2568.
Exports of Completely Built Units
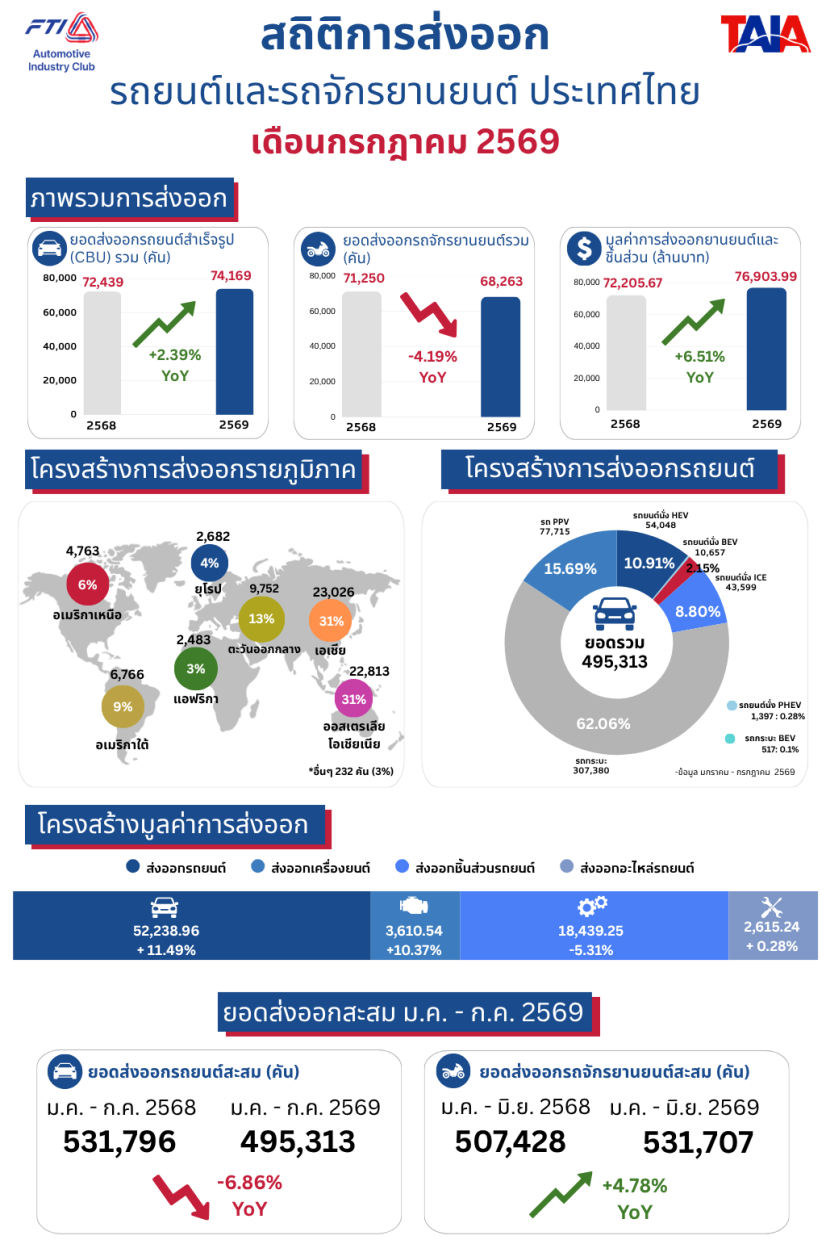
In July 2569, 74,169 units were exported, an increase of 2.39% from July 2568. This increase was driven by the Australian and Oceania market, which is the largest with a 30.25% market share, growing by 29.16% from the same month last year. Following that is the Asian market with a 28.92% market share, up 14.79%, and the Central and South American market with a 9.74% market share, up 3.55%. The Middle East market share decreased from 20.40% last year to 14.56% due to a 33.56% decrease in exports. The Middle East market still has normal demand, but there are safety concerns for ships passing through the Strait of Hormuz, requiring the search for safer alternative shipping routes, leading to a 5-month decline in exports.
Details are as follows:
• Pickup trucks totaled 43,275 units, accounting for 58.35% of total exports, an increase of 2.02% from July 2568.
• BEV pickup trucks totaled 299 units, accounting for 0.40% of total exports, an increase of 536.17% from July 2568.
• ICE passenger cars totaled 6,323 units, accounting for 8.53% of total exports, a decrease of 60.84% from July 2568.
• BEV passenger cars totaled 1,799 units, accounting for 2.43% of total exports, an increase of 1,399.17% from July 2568.
• PHEV passenger cars totaled 253 units, accounting for 0.34% of total exports. There were no exports in July 2568.
• HEV passenger cars totaled 10,195 units, accounting for 13.75% of total exports, an increase of 163.16% from July 2568.
• PPV vehicles totaled 12,025 units, accounting for 16.21% of total exports, an increase of 22.27% from July 2568.
The value of automobile exports in July 2569 was 52,238.96 million baht, an increase of 11.49% from July 2568. The export value of engines, automotive parts, and automobile spare parts is detailed as follows:
• Engines had an export value of 3,610.54 million baht, an increase of 10.37% from July 2568.
• Automotive parts had an export value of 18,439.25 million baht, a decrease of 5.31% from July 2568.
• Automobile spare parts had an export value of 2,615.24 million baht, an increase of 0.28% from July 2568.
The total export value of completely built automobiles, engines, automotive parts, and automobile spare parts in July 2569 was 76,903.99 million baht, an increase of 6.51% from July 2568.
Motorcycles
In July 2569, 68,263 motorcycles were exported, a decrease of 4.19% from July 2568, with an export value of 5,151.15 million baht, a decrease of 1.81% from July 2568.
• Motorcycle parts had a total export value of 188.20 million baht, a decrease of 16.58% from July 2568.
• Motorcycle spare parts had a total export value of 284.69 million baht, an increase of 52.75% from July 2568.
The total export value of motorcycles, parts, and motorcycle spare parts in July 2569 was 5,624.04 million baht, a decrease of 0.60% from July 2568.
Therefore, in July 2569, the total export value of completely built automobiles, engines, automotive parts, automobile spare parts, motorcycles, parts, and motorcycle spare parts was 82,528.03 million baht, an increase of 5.99% from July 2568.
Completely built automobiles
From January-July 2569, 495,313 completely built automobiles were exported, a decrease of 6.86% from the same period, categorized as follows:
• Pickup trucks totaled 307,380 units, accounting for 62.06% of total exports, a decrease of 8.90% from January-July 2568.
• BEV pickup trucks totaled 517 units, accounting for 0.10% of total exports, an increase of 338.14% from January-July 2568.
• ICE passenger cars totaled 43,599 units, accounting for 8.80% of total exports, a decrease of 49.76% from January-July 2568.
• BEV passenger cars totaled 10,657 units, accounting for 2.15% of total exports, an increase of 1,259.31% from January-July 2568.
• PHEV passenger cars totaled 1,397 units, accounting for 0.28% of total exports. There were no exports from January-July 2568.
• HEV passenger cars totaled 54,048 units, accounting for 10.91% of total exports, an increase of 76.63% from January-July 2568.
• PPV vehicles totaled 77,715 units, accounting for 15.69% of total exports, an increase of 2.11% from January-July 2568.
The value of automobile exports from January-July 2569 totaled 341,426.66 million baht, a decrease of 5.48% from January-July 2568, with details as follows:
• Engines had an export value of 22,138.25 million baht, an increase of 1.69% from January-July 2568.
• Automotive parts had an export value of 107,202.41 million baht, a decrease of 6.45% from January-July 2568.
• Automobile spare parts had an export value of 14,243.69 million baht, a decrease of 9.89% from January-July 2568.
The total export value of automobiles, engines, automotive parts, and spare parts from January-July 2569 was 485,011.00 million baht, a decrease of 5.53% from January-July 2568.
Motorcycles
From January-July 2569, 531,707 motorcycles were exported, an increase of 4.78% from January-July 2568, with a value of 38,153.73 million baht, an increase of 3.19% from January-July 2568.
• Motorcycle parts had a total export value of 1,897.43 million baht, an increase of 45.38% from January-July 2568.
• Motorcycle spare parts had a total export value of 1,797.40 million baht, an increase of 21.38% from January-July 2568.
The total export value of motorcycles, parts, and motorcycle spare parts from January-July 2569 was 41,848.56 million baht, an increase of 5.25% from January-July 2568.
From January-July 2569, the total export value of completely built automobiles, engines, other parts, automobile spare parts, motorcycles, parts, and motorcycle spare parts was 526,859.56 million baht, a decrease of 4.75% from January-July 2568.
Registration data by fuel type for July 2569 (Passenger Car Type 1 only)
In July 2569, there were 50,964 vehicles registered by fuel type, an increase of 12.06% from last year, categorized as follows:
• Electric (BEV) vehicles totaled 21,024 units, an increase of 111.85% from the same period last year.
• Gasoline vehicles totaled 8,023 units, a decrease of 32% from the same period last year.
• Diesel vehicles totaled 8,093 units, a decrease of 25.13% from the same period last year.
• Hybrid (HEV) vehicles totaled 11,864 units, an increase of 1.72% from the same period last year.
• Plug-in Hybrid (PHEV) vehicles totaled 1,955 units, an increase of 52.02% from the same period last year.
• Others totaled 5 units, an increase from the same period last year when there were no registrations.
From January-July 2569, there were 377,313 vehicles registered by fuel type, an increase of 16.45% from last year, categorized as follows:
• Electric (BEV) vehicles totaled 124,111 units, an increase of 88.83% from the same period last year.
• Gasoline vehicles totaled 63,935 units, a decrease of 25.29% from the same period last year.
• Diesel vehicles totaled 75,413 units, a decrease of 2.01% from the same period last year.
• Hybrid (HEV) vehicles totaled 101,682 units, an increase of 22.30% from the same period last year.
• Plug-in Hybrid (PHEV) vehicles totaled 12,161 units, a decrease of 3.45% from the same period last year.
• Others totaled 11 units, an increase of 450% from the same period last year.
New BEV Registrations in July 2569
In July 2569, new Battery Electric Vehicles (BEV) registered totaled 24,171 units, an increase of 99.36% from July last year, categorized as follows:
• Passenger cars and various types of vehicles totaled 21,159 units, an increase of 106.89% from July 2568.
o Passenger cars totaled 21,030 units
o Passenger vehicles not exceeding 7 persons totaled 121 units
o Tourist service vehicles totaled 8 units
• Pickup trucks and vans totaled 210 units, an increase of 467.57% from July 2568.
• Motorcycles totaled 2,727 units, an increase of 59.29% from July 2568. Personal motorcycles totaled 2,727 units.
• Three-wheeled vehicles totaled 5 units, an increase of 66.67% from July 2568.
o Personal three-wheeled vehicles totaled 5 units
• Buses totaled 22 units, an increase of 214.29% from July last year.
• Trucks totaled 48 units, a decrease of 65.22% from July last year.
From January-July 2569, accumulated new Battery Electric Vehicle (BEV) registrations totaled 144,181 units, an increase of 77.75% from January-July last year, categorized as follows:
• Passenger cars and various types of vehicles totaled 126,439 units, an increase of 88% from January-July 2568.
-Passenger cars totaled 124,162 units
-Passenger vehicles not exceeding 7 persons totaled 2,223 units
- Business service vehicles totaled 20 units
- Tourist service vehicles totaled 34 units
• Pickup trucks and vans totaled 488 units, an increase of 44.81% from January-July 2568.
• Three-wheeled vehicles totaled 30 units, an increase of 200% from January-July 2568.
- Personal three-wheeled vehicles totaled 30 units
• Motorcycles totaled 16,883 units, an increase of 27.41% from January-July 2568.
- Personal motorcycles totaled 14,154 units
- Public motorcycles totaled 2 units
• Buses totaled 101 units, an increase of 44.29% from January-July 2568.
• Trucks totaled 240 units, an increase of 28.34% from January-July 2568.
New HEV Registrations in July 2569
In July 2569, new Hybrid Electric Vehicles (HEV) registered totaled 12,038 units, an increase of 1.89% from July last year, categorized as follows:
• Passenger cars and various types of vehicles totaled 11,878 units, an increase of 1.54% from July 2568.
-Passenger cars totaled 11,864 units
- For-hire passenger vehicles not exceeding 7 persons 2 units
- Business service vehicles totaled 7 units
- Tourist service vehicles totaled 5 units
• Motorcycles totaled 160 units, a decrease of 36.75% from January-July 2568.
- Personal motorcycles totaled 160 units
From January-July 2569, accumulated new Hybrid Electric Vehicle (HEV) registrations totaled 102,325 units, an increase of 21.63% from January-July last year, categorized as follows:
• Passenger cars and various types of vehicles totaled 101,756 units, an increase of 21.96% from January-July 2568.
- Passenger cars totaled 101,682 units
- Passenger vehicles not exceeding 7 persons totaled 10 units
- Business service vehicles totaled 17 units
- Tourist service vehicles totaled 47 units
• Motorcycles totaled 569 units, a decrease of 18.01% from January-July 2568.
- Personal motorcycles totaled 569 units
New PHEV Registrations in July 2569
In July 2569, new Plug-in Hybrid Electric Vehicles (PHEV) registered totaled 1,955 units, an increase of 52.02% from July last year, categorized as follows:
• Passenger cars and various types of vehicles totaled 1,955 units, an increase of 52.02% from July last year.
- Passenger cars totaled 1,955 units
From January-July 2569, accumulated new Plug-in Hybrid Electric Vehicle (PHEV) registrations totaled 12,169 units, a decrease of 3.67% from January-July last year, categorized as follows:
• Passenger cars and various types of vehicles totaled 12,169 units, a decrease of 3.67% from January-July last year.
- Passenger cars totaled 12,161 units
- Business service vehicles 5 units
- Tourist service vehicles 3 units
Accumulated BEV Registrations as of July 31, 2569
As of July 31, 2569, accumulated Battery Electric Vehicle (BEV) registrations totaled 515,357 units, an increase of 67.64% from last year, categorized as follows:
• Passenger cars and various types of vehicles totaled 406,654 units, an increase of 79.74% from the same period in 2568.
- Passenger cars totaled 394,494 units, an increase of 78.44% from the same period in 2568.
- Passenger vehicles not exceeding 7 persons totaled 8,846 units, an increase of 129.59% from the same period in 2568.
- Business service vehicles totaled 269 units, an increase of 20.63% from the same period in 2568.
- Tourist service vehicles totaled 363 units, an increase of 69.63% from the same period in 2568.
- Rental service vehicles totaled 6 units, an increase of 100% from the same period in 2568.
- For-hire vehicles via electronic system totaled 2,676 units, an increase of 207.23% from the same period in 2568.
• Pickup trucks and vans totaled 2,037 units, an increase of 68.63% from the same period in 2568.
• Three-wheeled vehicles totaled 1,064 units, an increase of 3.10% from the same period in 2568.
- Personal three-wheeled vehicles totaled 158 units, an increase of 29.51% from the same period in 2568.
- For-hire three-wheeled vehicles totaled 906 units, a decrease of 0.44% from the same period in 2568.
• Motorcycles totaled 101,081 units, an increase of 34.78% from the same period in 2568.
- Personal motorcycles totaled 100,872 units, an increase of 34.69% from the same period in 2568.
- Public motorcycles totaled 209 units, an increase of 95.33% from the same period in 2568.
- Others
-Buses totaled 2,985 units, an increase of 4.55% from the same period in 2568.
- Trucks totaled 1,536 units, an increase of 40.66% from the same period in 2568.
Accumulated HEV Registrations as of July 31, 2569
As of July 31, 2569, accumulated Hybrid Electric Vehicle (HEV) registrations totaled 706,284 units, an increase of 27.84% from last year, categorized as follows:
• Passenger cars and various types of vehicles totaled 695,858 units, an increase of 28.24% from the same period in 2568.
- Passenger cars totaled 693,778 units, an increase of 28.20% from the same period in 2568.
- For-hire passenger vehicles totaled 516 units, an increase of 0.58% from the same period in 2568.
- Business service vehicles totaled 265 units, an increase of 26.19% from the same period in 2568.
- Tourist service vehicles totaled 389 units, an increase of 22.71% from the same period in 2568.
- Rental service vehicles totaled 9 units, an increase of 28.57% from the same period in 2568.
- For-hire vehicles via electronic system totaled 901 units, an increase of 121.9% from the same period in 2568.
• Pickup trucks and vans totaled 1 unit, the same as the same period in 2568.
• Motorcycles totaled 10,423 units, an increase of 5.71% from the same period in 2568.
- Personal motorcycles totaled 10,423 units, an increase of 5.71% from the same period in 2568.
• Others
- Buses totaled 2 units, which is the same as the period.
Accumulated PHEV Registrations as of July 31, 2569
As of July 31, 2569, accumulated Plug-in Hybrid Electric Vehicle (PHEV) registrations totaled 93,324 units, an increase of 23.29% from last year, categorized as follows:
• Passenger cars and various types of vehicles totaled 93,324 units, an increase of 23.29% from last year.
- Passenger cars totaled 93,229 units, an increase of 23.31% from the same period in 2568.
- For-hire passenger vehicles not exceeding 7 persons totaled 1 unit. There were no registrations in the same period of 2568.
- Business service vehicles totaled 43 units, a decrease of 14% from the same period in 2568.
- Tourist service vehicles totaled 31 units, an increase of 14.81% from the same period in 2568.
- Rental service vehicles had no registrations, a decrease of 100% from the same period in 2568.
- For-hire vehicles via electronic system totaled 20 units, an increase of 233.33% from the same period in 2568.